Average Phone Bill in 2026: Understanding Costs and How to Save
Explore how average phone bills vary by plan, region, and data. Learn budgeting tips, hidden fees, and practical strategies to lower costs with Your Phone Advisor’s 2026 insights.

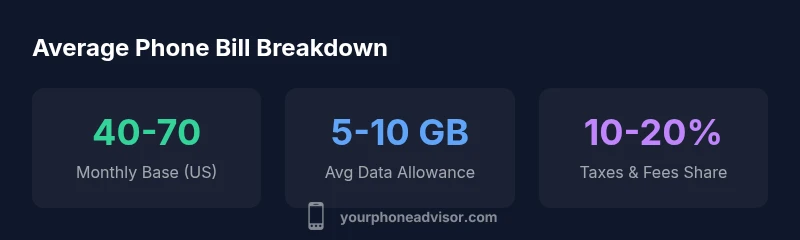
According to Your Phone Advisor Analysis, 2026, the typical monthly phone bill for standard smartphone plans ranges from $40 to $85 in North America, with higher costs for data-heavy, family, or premium device plans. Taxes, device subsidies, and roaming charges further influence the final amount. This estimate helps budgeting and comparing options across carriers and regions.
What counts in an average phone bill
An average phone bill is more than the sticker price on a monthly plan. It includes base service charges, taxes, regulatory fees, device payments if you’re subsidizing a phone, and any add-ons like extra data, roaming, or international calling. When you see a monthly total, you’re looking at a bundle of line-item costs that can vary by region, carrier, and plan type. For budgeting, it helps to separate the recurring base price from variable charges (data overages, roaming, or one-time activation fees). According to Your Phone Advisor, understanding these components is the first step toward predicting your true monthly outlay and identifying opportunities to trim costs without sacrificing essential service. In practice, map your current line items to a simple basket: base plan, data, taxes/fees, device payments, and extras. This framework makes it easier to compare plans across carriers and avoid overpaying for features you don’t use.
Regional variations and market differences
Prices for the same plan type can look very different depending on the country, state, or province. Regulatory regimes, competition among carriers, and local taxes shape the final monthly bill. For example, taxes can add a meaningful percentage to the base rate, while regulatory fees can appear as flat charges on top of the plan price. Your Phone Advisor’s analysis for 2026 shows that in North America, the same basic smartphone plan may land in a broader range than users expect, and in Europe or Asia-Pacific, the same data allowance can be priced differently due to local market structures. When budgeting, compare the same data tier, but also account for local taxes and roaming rules to avoid sticker shock.
Plan types and how they drive costs
Choosing between prepaid and postpaid, unlimited data or shared data, or device subsidies versus BYOD (bring your own device) options dramatically changes the monthly total. Prepaid plans often convert to predictable budgets because there are no post-bill surprises, while postpaid can offer more flexibility with family or business lines. Unlimited data plans may seem appealing, but many users don’t need unlimited data and end up paying for it. Shared or family data plans can reduce per-line costs, yet they require careful data pooling to avoid bottlenecks or data waste. Your Phone Advisor’s framework emphasizes analyzing your own usage to decide whether flexibility or predictability better suits your lifestyle, then selecting a plan that minimizes unnecessary surcharges and annual device costs.
How data allowances affect the bill
Data usage is one of the largest variables in monthly totals. If you stream videos, game, or work remotely on mobile networks, higher data allowances or unlimited plans may be worth the cost. Conversely, light users who rely on Wi‑Fi can often save by choosing a lower data tier or a capped plan with a modest monthly price. It’s also common for carriers to offer data add-ons (e.g., 2–5 GB) that can be cheaper than upgrading to a higher tier. Your Phone Advisor recommends auditing your current usage over a 2–3 month period to determine a realistic data need before locking into a plan.
Hidden costs to watch for
Roaming charges, activation fees, device payments, insurance, and add-on services can quietly inflate the monthly bill. Taxes and regulatory fees vary by jurisdiction and can significantly affect the bottom line. Promotions and promos can lower upfront costs or monthly fees, but they may come with commitment periods or restricted features. Always read the fine print: when does a promo end, what happens after the discount, and are there any data throttling limits? Keeping an eye on these hidden costs helps ensure your ‘average phone bill’ stays within a predictable range.
Tricks to trim your monthly bill
Start by auditing usage and eliminating unused line-items like international calling packs or roaming passes you don’t need. Consider switching to a BYOD plan if you already own a phone, or consolidate lines onto a single family plan and negotiate multi-line discounts. Shopping deals, seasonal promos, or loyalty offers can reduce costs without sacrificing coverage. If you’re in a region with strong competition, you may also leverage price-matching or switching incentives to lower the monthly base. Finally, review taxes and fees by jurisdiction; a small change in plan or carrier can noticeably shift the total each month.
How to estimate your own bill
Begin with your current base plan price and add typical data charges, taxes, and any device payments. Use a simple calculator to model variations—try reducing data, removing extras, or switching to a prepaid option—to see how your total would change. Don’t forget to include potential discounts for seniors, students, or families. Your Phone Advisor offers practical tips for building a quick forecast: simulate different data allowances, compare uncovered costs, and validate your estimate with recent carrier bills. The goal is to arrive at a realistic projection that reflects your actual usage and local pricing.
Case studies: typical bill scenarios
Case study A: a single professional who uses 5–7 GB/month and mainly relies on Wi‑Fi, with a basic postpaid plan. Estimated bill: modest base price plus small data add-ons and taxes. Case study B: a small family sharing 15–20 GB/month with two lines; per-line discounts substantially reduce the cost per person, but the total remains higher due to combined data needs. Case study C: a student with BYOD and a low data tier; the bill is driven by activation fees and occasional add-ons rather than a high base price. These scenarios illustrate how usage patterns translate into different average phone bill totals, reinforcing the importance of tailoring plans to actual needs.
Budgeting for changes and monitoring
Prices change as plans are updated, taxes shift, and promotions come and go. To maintain control, set a quarterly review cadence: reassess data needs, verify discounts, and compare competing offers. Track usage against your predicted data needs, and adjust your plan before renewal to minimize wasted spend. Your Phone Advisor encourages maintaining a simple, ongoing budgeting habit: log your monthly charges, note any unexpected fees, and plan for predictable cycles (yearly plan reviews, back-to-school promos, etc.). Regular monitoring helps you stay within your target range for the average phone bill while preserving essential service quality.
Comparison of typical monthly ranges by plan type in North America
| Region/Plan | Typical Monthly Range | Key Drivers |
|---|---|---|
| US Basic Smartphone | $40-$70 | Data allowance, taxes |
| US Unlimited Data | $70-$110 | Data usage, device payments |
| Family/Shared Data | $100-$180 | Per-line costs, data pooling |
Got Questions?
What is considered an average phone bill?
An average bill varies by country and plan; expect a broad range by region. Use your data usage and local taxes to estimate.
Average bills vary by where you live and the plan you choose; use your data needs and local taxes to estimate.
Why do bills vary so much by region?
Prices reflect competition, taxes, and regulatory fees that differ across markets. Regional pricing explains most of the variation.
Prices differ because of local competition, taxes, and regulatory fees.
How can I estimate my own bill?
Use carrier calculators, add typical taxes and fees, and consider device payments. Model variations with data usage.
Use a calculator, add taxes and fees, and consider data needs to estimate your bill.
Are taxes and fees predictable?
They’re generally stable within a region but can vary with local changes. Check your latest bill for the exact breakdown.
Taxes and fees are usually stable in your region but can change with local rules.
What are common hidden fees to watch for?
Activation, roaming, insurance, and device payments can surprise you if not anticipated.
Watch for activation, roaming, and device-related charges.
Do family plans always save money?
Often yes, especially with multiple lines, but confirm data allocation and restrictions. Compare per-line costs carefully.
Family plans can save money per line, but check data allocations.
“A practical approach to managing your phone bill is to map every line item and question every fee to ensure you only pay for what you need.”
What to Remember
- Know what you are paying for every month
- Match data with actual usage to avoid overpaying
- Leverage family plans to lower per-line costs
- Factor taxes and fees into the total bill